The Economics of Indoor Golf

An estimated 9 million Americans played golf on a simulator last year — more than double the figure from five years ago. Add in tech-enabled ranges, covered bay concepts, and putting entertainment venues, and off-course golf has become one of the sport’s fastest-growing economic engines.
But demand is not the same as durable economics. And the distance between those two things is where value is either created or destroyed.
Golf is a $140B+ industry. Every week, we break down what's actually driving it. Welcome to the new members who've joined since our last send — you're now part of a growing community of 11,000+ golfers who follow the business of the game. If someone forwarded this to you, subscribe below.
Read Time: 6 Minutes
The Market: Bigger Than You Think
Off-course golf participation in the United States reached an estimated 38 million people in 2025 — surpassing on-course golfers for the fourth consecutive year. The category spans simulator lounges, tech-enabled driving ranges, covered bay concepts, and putting entertainment venues, and it is still early: only an estimated 6.5% of U.S. golf facilities have added any form of simulator or ball-tracking technology.
South Korea shows what a mature indoor golf market looks like at scale. Golfzon alone powers over 51,000 simulators globally, with an estimated 102 million rounds played annually and more than 6 million registered members. The domestic Korean screen golf market generates an estimated $1.5 to $2 billion in annual venue revenue. More rounds of golf are played indoors than outdoors in South Korea, and have been for years.
The U.S. is earlier in that curve, but the direction is the same.
The Equation
Year-round off-course golf economics — whether fully enclosed simulators, covered tech-enabled ranges, or putting entertainment venues — reduce to a simple formula:
Revenue (utilization x revenue per hour + incremental F&B + membership base) minus Cost (CapEx burden + operating structure), adjusted for churn.
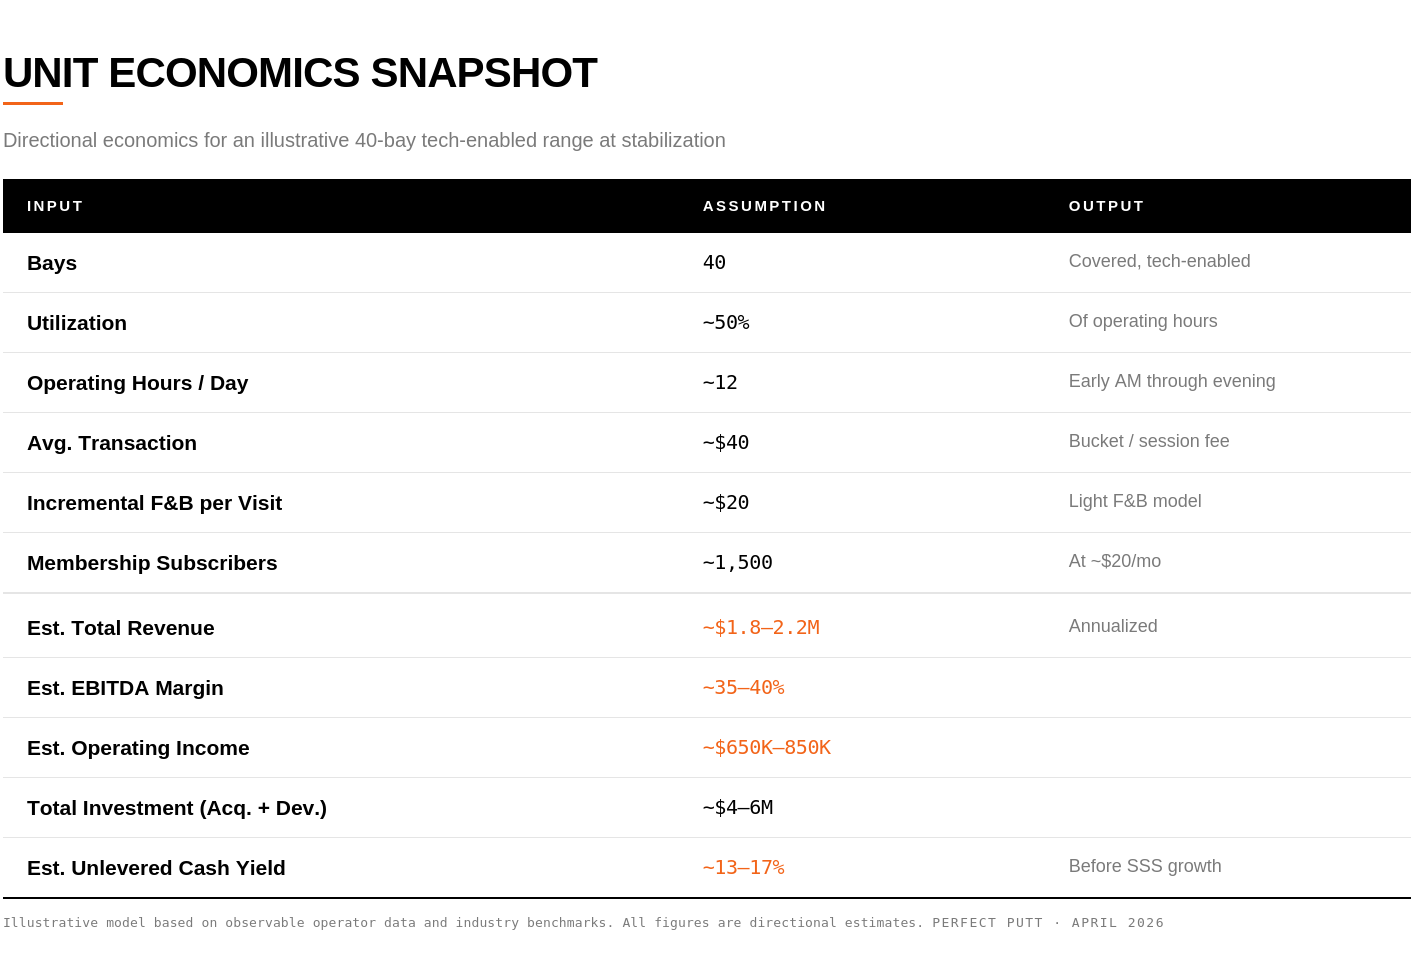
Get those inputs right, and a facility generating an estimated $1.5 to $2 million in annual revenue on $3 to $6 million of invested capital can produce estimated unlevered returns in the 20 to 35% range. Consider a directional example: a 40-bay tech-enabled range at 50% utilization, running 12 hours a day with an estimated $40 average transaction and incremental $20 F&B spend, producing roughly $1.8 to $2.2 million in total revenue. At an estimated 35 to 40% EBITDA margin, that facility generates $650,000 to $850,000 in operating income on a $5 million investment — a 13 to 17% unlevered cash yield before same-store growth or membership upside. Get two inputs wrong — particularly utilization and cost structure — and the model produces single-digit or negative returns, regardless of how strong the brand or the demand environment appears.
Every operator in this category, from a six-bay simulator lounge to a $50 million dome complex, lives or dies on the same five levers.
1. Utilization and Throughput
This is the single most important input. A simulator bay or a covered hitting stall is a fixed asset. It generates revenue only when someone is standing in front of it.
Industry data suggests the average simulator session lasts about 90 minutes with a group of approximately three players. At an estimated $55 per session, a single bay generates roughly $55 to $65 per occupied hour. Tech-enabled driving ranges using ball-tracking technology like Toptracer operate on a different pricing model — by the bucket rather than by the hour — but the underlying math is the same: revenue per bay per operating hour determines whether the facility covers its fixed costs.
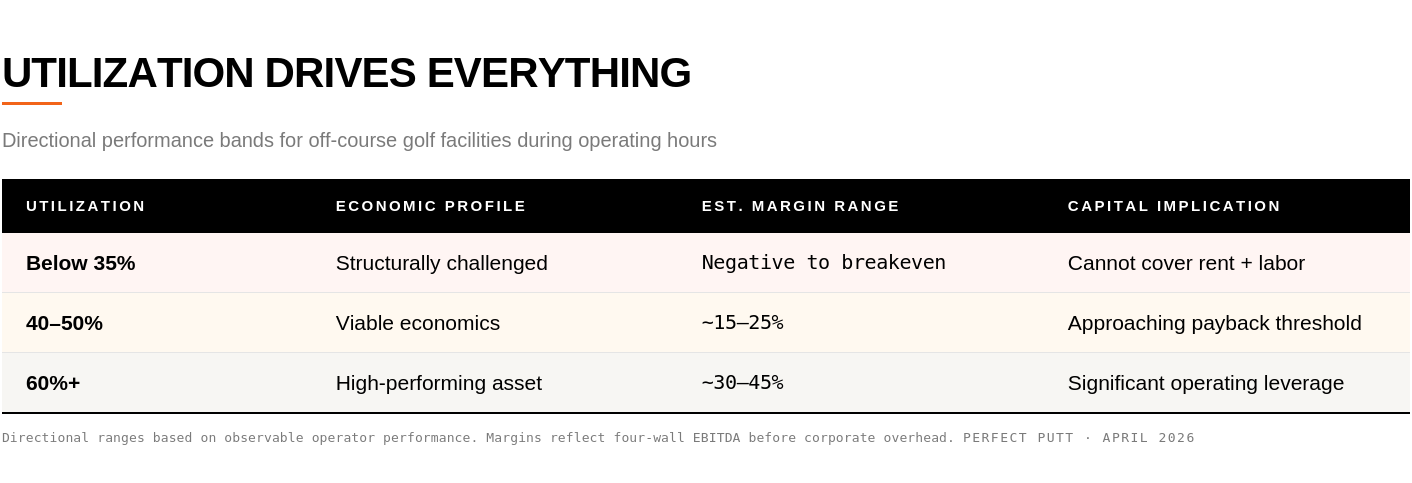
Directionally, facilities below 35% utilization during operating hours are structurally challenged — they cannot cover rent and labor. The 40 to 50% range is where viable economics begin. Above 60%, the model becomes a high-performing asset with significant operating leverage. The operators that reach those levels extend hours beyond traditional golf windows and fill off-peak slots with programming — leagues, corporate events, lessons, youth academies.
2. Food & Beverage Capture
The primary margin driver in off-course golf is the golf product itself — utilization, throughput, and pricing on the bays or buckets. F&B is not the engine. But done correctly — particularly through a light model with low COGS and minimal incremental labor — it increases per-visit revenue without proportionally increasing cost.
The average indoor golf customer spends an estimated $40 on food and beverages per visit on top of the session fee. For a facility already covering its fixed costs through the core product, that incremental spend drops to the bottom line at attractive contribution margins — especially when the format is container-based service, grab-and-go, or a simple bar rather than a full-service kitchen.
PopStroke is the outlier: essentially a restaurant with a putting course attached, reportedly achieving estimated four-wall EBITDAR in the range of 55% to 60% at its strongest locations. But that is a food-first concept by design. For most off-course formats, the right framing is not “F&B drives the margin” — it is “F&B extends the margin the golf product already creates.”
3. Membership and Subscription Revenue
Recurring revenue changes everything in a venue-based business. It smooths cash flow and creates behavioral lock-in that drives visit frequency — the single best predictor of retention.
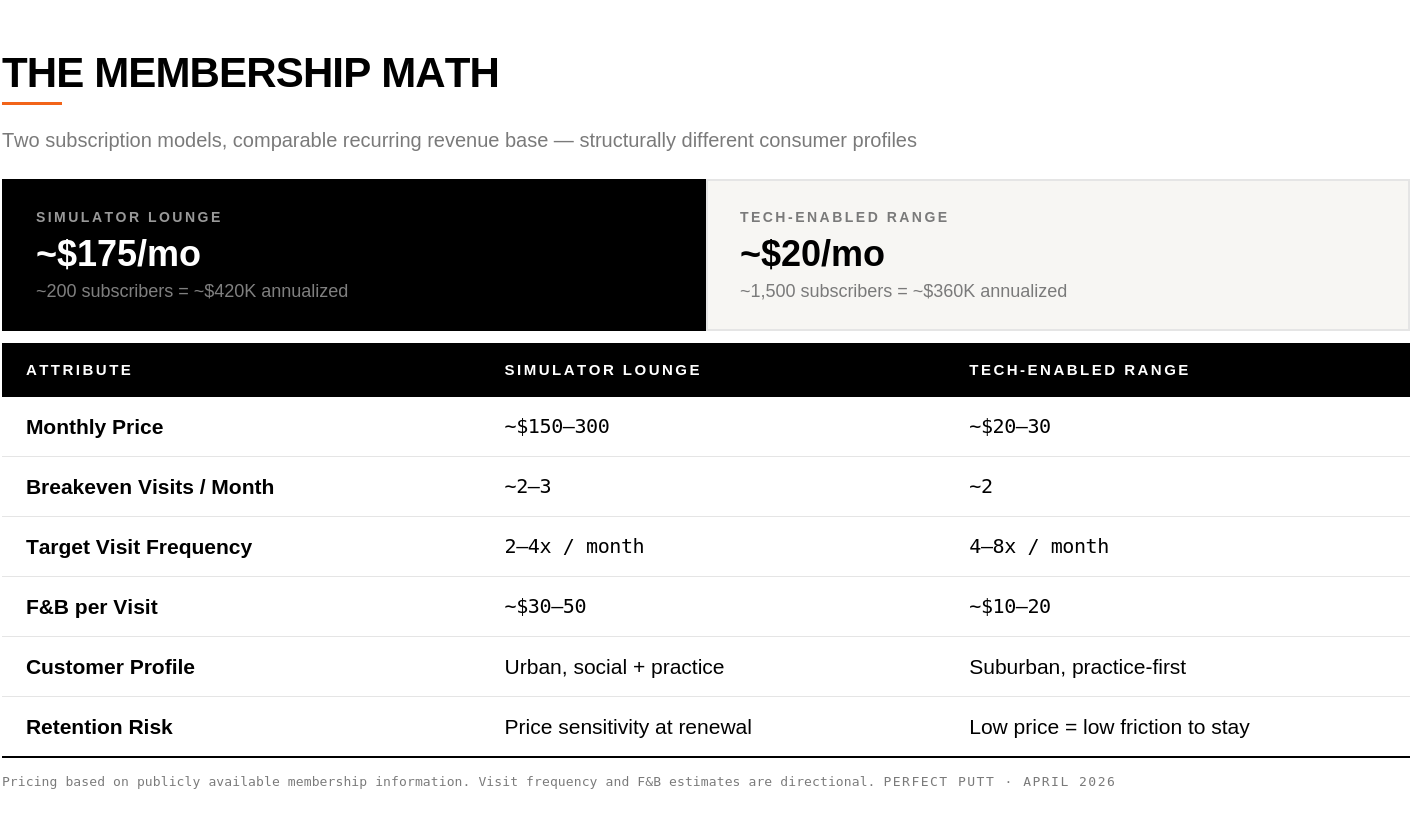
The pricing models vary significantly. Five Iron charges approximately $150 to $300 per month with free daily simulator access during off-peak hours. X-Golf, the largest franchise model with an estimated 139 U.S. locations, runs a similar structure. At the other end, tech-enabled range operators sell monthly passes at $20 to $30 — priced to pay for itself in two visits. Both approaches work when the math holds: a simulator facility with 200 members at $175 per month generates over $400,000 in annualized recurring revenue. A range with 1,500 subscribers at $20 per month produces a comparable base of roughly $360,000 — plus incremental per-visit spend on buckets, F&B, and retail.
Golfzon’s model in South Korea leans on volume at roughly $20 per round — and at 102 million rounds annually across 51,000 simulators, the frequency economics clearly work. More than 60% of Korean golfers play both screen and outdoor golf, creating a dual-engagement loop.
4. CapEx Discipline and Cost Structure
This is where the equation breaks — or compounds.
At its peak, Topgolf was spending an estimated $30 to $50 million per venue. When benchmark interest rates jumped from near zero to above 5%, the financing model inverted. Same-venue sales declined an estimated 3% in 2023, 9% in 2024, and roughly 10% into 2025. Callaway eventually sold 60% of Topgolf at approximately $1.1 billion — roughly 45% below its original acquisition price. Close to $900 million in value, destroyed. The failure was not the concept. It was a cost structure that required sustained high-volume traffic to service its capital — and traffic declined.
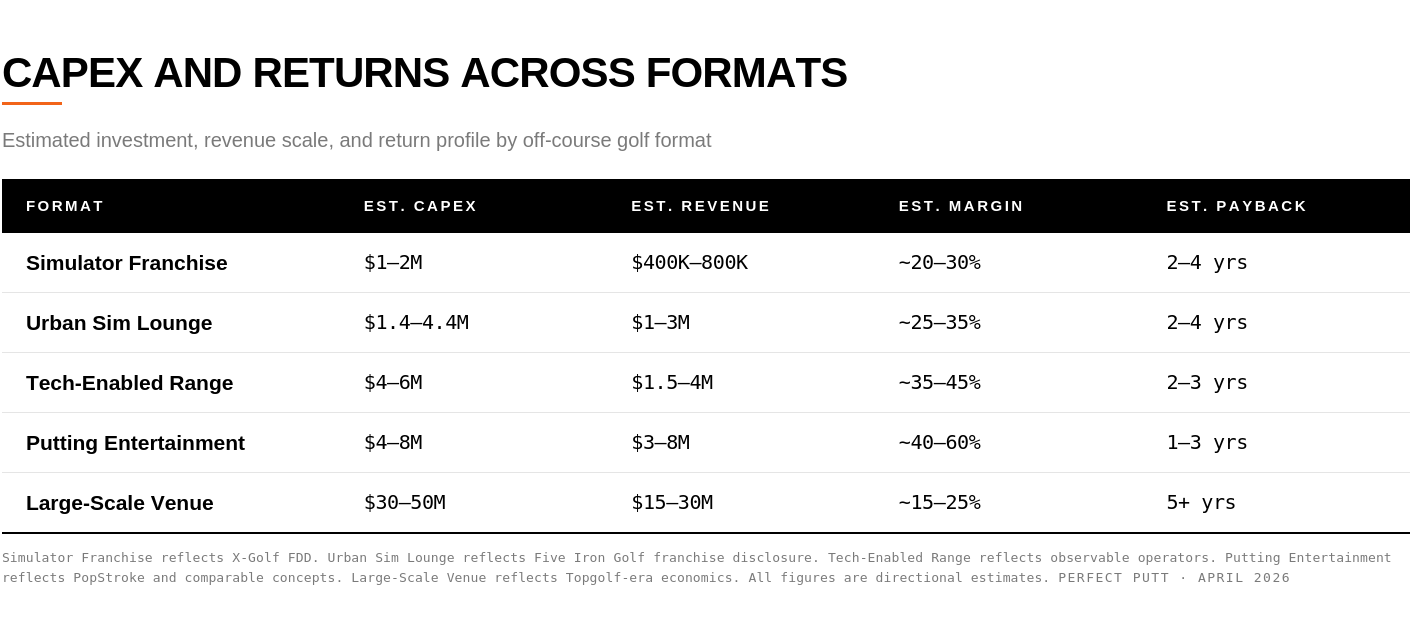
The operators getting this right are working at fundamentally different investment levels. Five Iron’s franchise investment ranges from an estimated $1.4 to $4.4 million per location. X-Golf runs at roughly $1 to $2 million. Tech-enabled range operators — acquiring underperforming driving ranges, adding covered bays, ball-tracking technology, light F&B, and branded membership programs — are deploying an estimated $4 to $6 million per location, with the strongest reporting estimated EBITDA margins north of 40% and estimated payback periods inside three years. At a $50 million build, the required utilization to produce comparable returns becomes nearly impossible to sustain without extraordinary pricing power and repeat traffic.
5. Churn Reduction and Wallet Share
The silent killer is novelty decay. Topgolf’s declining same-venue sales are the clearest cautionary data: once the novelty wore off, no amount of discounting or loyalty programming reversed the trend.
The operators that sustain engagement do so through community, competition, and progression — leagues, handicap tracking, lesson packages, events. Members visiting two to four times per month on a recurring subscription are the economic backbone of these businesses. Members visiting once a month or less are at high risk of cancellation inside six months — and when a facility loses a subscriber, the cost of replacing that recurring revenue is multiples of the cost of retaining it. The best facilities serve both the casual golfer who wants to hang out with friends and the serious player working on their game — and they build distinct programming for both.
Megalodome: Testing the Equation at Scale
Most off-course golf concepts are bay-based. Megalodome Golf, raising $50 million in development equity for a facility in Oswego, Illinois, is attempting something categorically different: a fully playable indoor golf course under climate-controlled domes — four interconnected structures spanning approximately 100 acres, with an executive 9-hole course, a 275-yard driving range, and teaching bays.
Run it through the equation: at $50 million in development capital, what utilization rate produces an adequate return? If the facility needs to generate an estimated $8 to $10 million in annual revenue to clear a reasonable cost of capital, can a 9-hole executive course in suburban Chicago command the repeat-visit pricing and frequency to get there? And if the model cannot replicate, the terminal value compresses to a single-asset destination play — a fundamentally different risk profile than a scalable platform.
The concept is ambitious. The questions it must answer are the same ones every operator in this category faces. It just faces them at a scale where the margin for error is thinnest.
The Takeaway
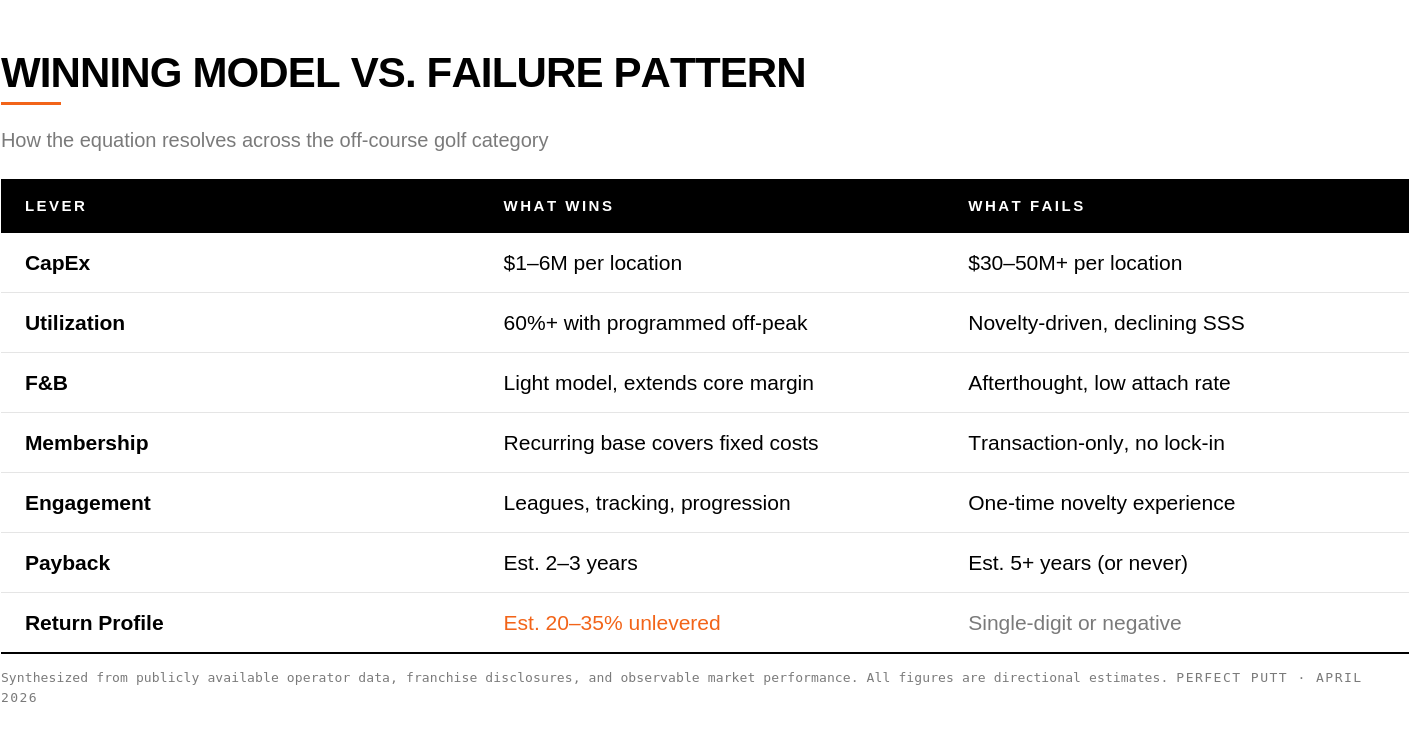
The indoor golf equation resolves cleanly.
What wins: moderate CapEx, high utilization, incremental F&B capture, recurring membership base, and programming that converts novelty into habit.
What fails: high capital intensity paired with low repeat frequency — regardless of how strong the initial demand signal looks.
Topgolf cultivated the off-course demand basin but lost nearly a billion dollars by getting the cost structure wrong. PopStroke, Golfzon, and the emerging class of tech-enabled range operators are proving the model works — but only when the economics are built from the ground up.
The best way to support Perfect Putt is to Subscribe and share with a friend.